Insights at our own issue tracking process using Python –
If you are part of a project team, chances are you work with some kind of software tool to track progress on individual tasks. In that tool you will find some predefined steps every task has to go through and you track progress by moving a task from step to step in the system. There are many reasons to use these kinds of tools, some important ones being:
1. Efficiency – Working on complex projects in big teams makes assigning every team member enough work fitting their skills a challenge
2. Quality – As multiple steps by different people are necessary to deliver features without defects the team needs to ensure no step is forgotten
3. Transparency – Stakeholders inside and outside the team should be able to assess progress make easily
At Ab Ovo, we have been using our current inhouse developed issue tracking software since 2011. These 9 years of history have a story to tell about we have been growing as an organization. Let’s use data analytics to uncover this story, asking the question:
How do our processes contribute to the Efficiency, Quality and Transparency of our project work?
What is process mining?
Process mining is the application of data analytics in order to understand processes. A process being a set of steps to be carried out in order to reach some goal, in our case building a piece of software, and the order in which those steps should be carried out. If you would like to know a bit more about process mining and its appliances please have a look at our process mining article.
We created all the analyses in this post using PM4PY which is implemented in python and thus is easily integrated in our data analytics tool chain.
Process discovery
One of the most useful class of process mining tools are process discovery algorithms. Given a log of events (in our case status updates on tasks) they reconstruct the underlying process model. Each discovery algorithm has its strengths and weaknesses. Some of them even guarantee a model explaining 100% of the observed behavior. In this case, we’re are not interested in that. Rather we would like to capture the most common work flows. We will judge all our models by two KPIs, both of them out-of-the box supported by PM4PY:
1. Simplicity – A model needs to be easy to understand and memorize so that team members can effortlessly follow it (Efficiency) without making mistakes (Quality). We give every model a score from 1 to 100 based on the number of connections each node has. A model offering few choices at every step would get a high score (even if there a many steps)
2. Fit – The model should of course explain the observed behavior. To calculate the fit, we replay every task from the log and percentage fitting the model.
Because in the end we need to balance those goals the algorithm should also be able to be calibrated by parameters. All of the above is offered by the Heuristic Miner algorithm.
Meet the data
The table below has metadate about progress on individual tasks. For every update on a task we have:
1. Project Usually the name of the customer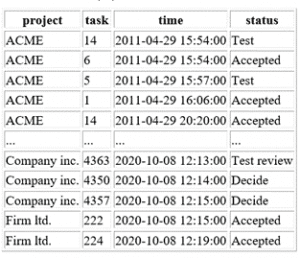
2. Task id of the task within the project
3. Time when the task was updated
4. Status which the task has after the update
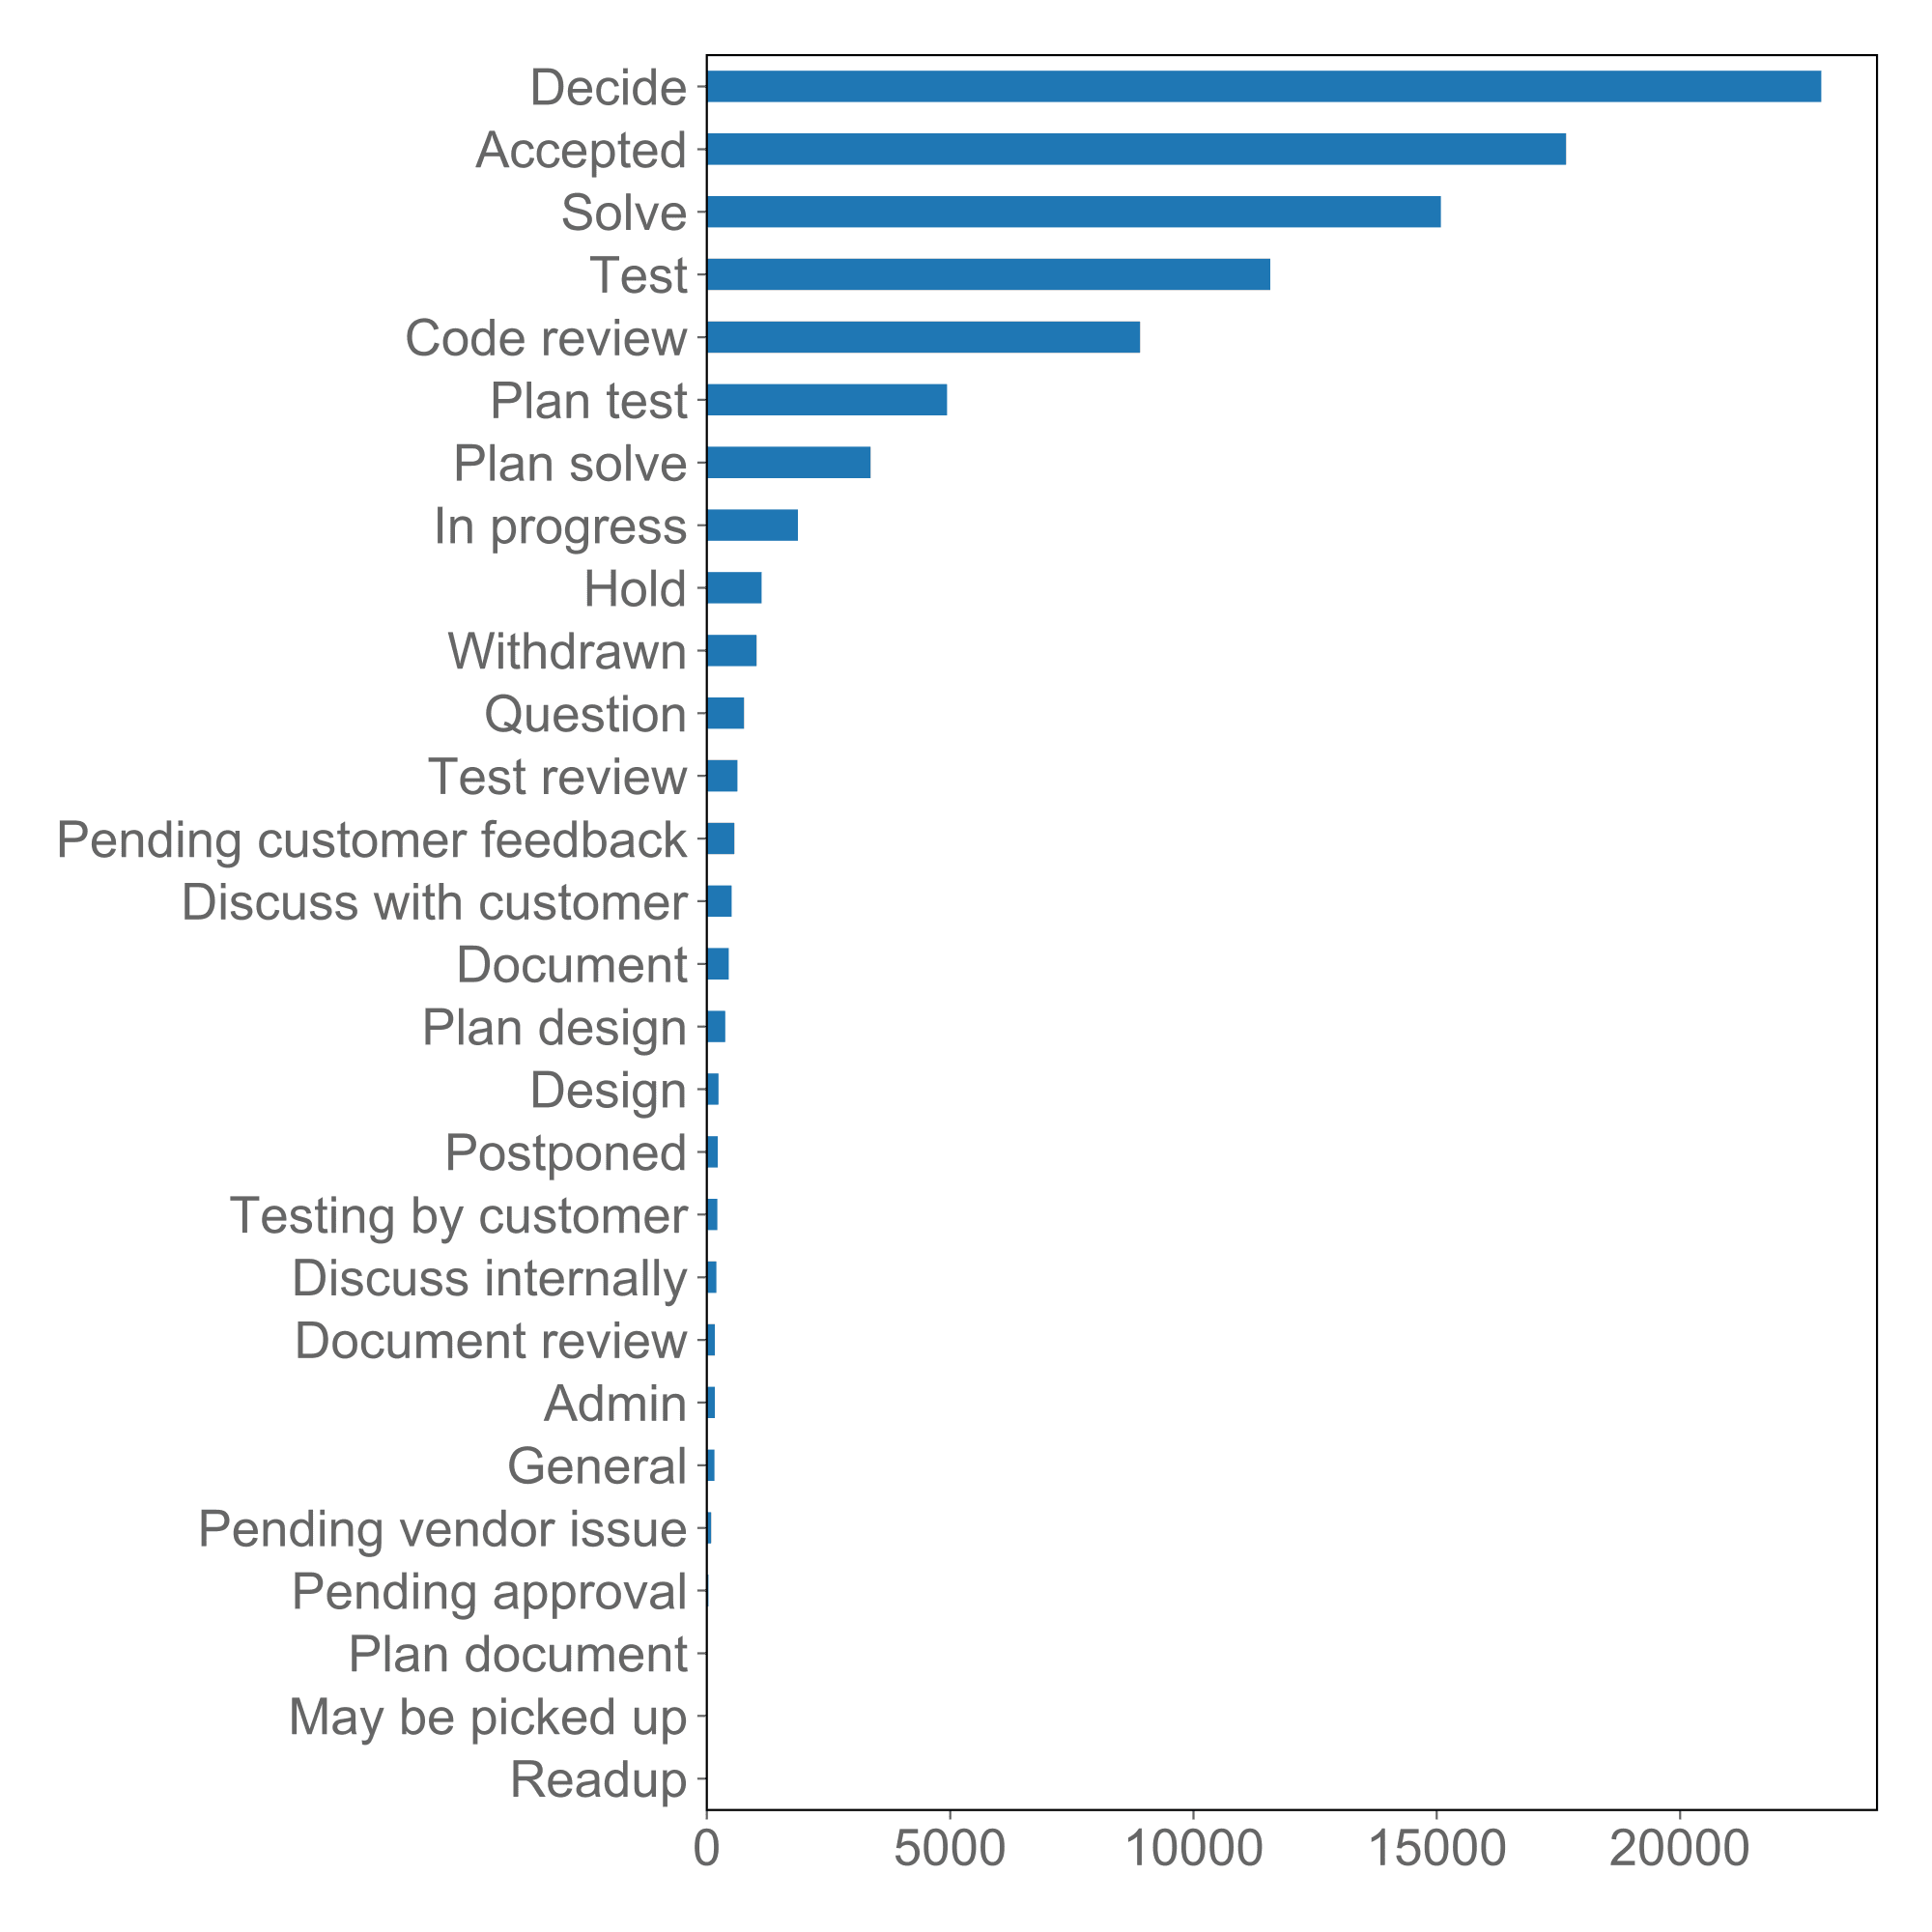
A task typically receives multiple updates over time, 2-5 would be typical. Issues can have one of close to 30 statuses, as can be seen in the graph below. The large number of statuses is evidence both of the wide variety of use cases to be covered and the various experiments we ran in the past with different process models. The concentration of the vast majority of updates on roughly the top 10 statuses shows the emergence of a core process model capturing most use cases.
Before we can start, we clean up the data a bit.
- We remove uncommon statuses, everything but the 10 most common ones to avoid an unnecessarily complex process model
- Furthermore, we remove the statuses “Decide”, “In progress” and “Hold”. Those are very generic and could occur in any step of the process
- We remove updates immediately following an update with the same status on the same task. In our system those kinds of updates typically stem from editing or assigning a task which is not really interesting from the perspective of this analysis
Now we can run the process discovery.
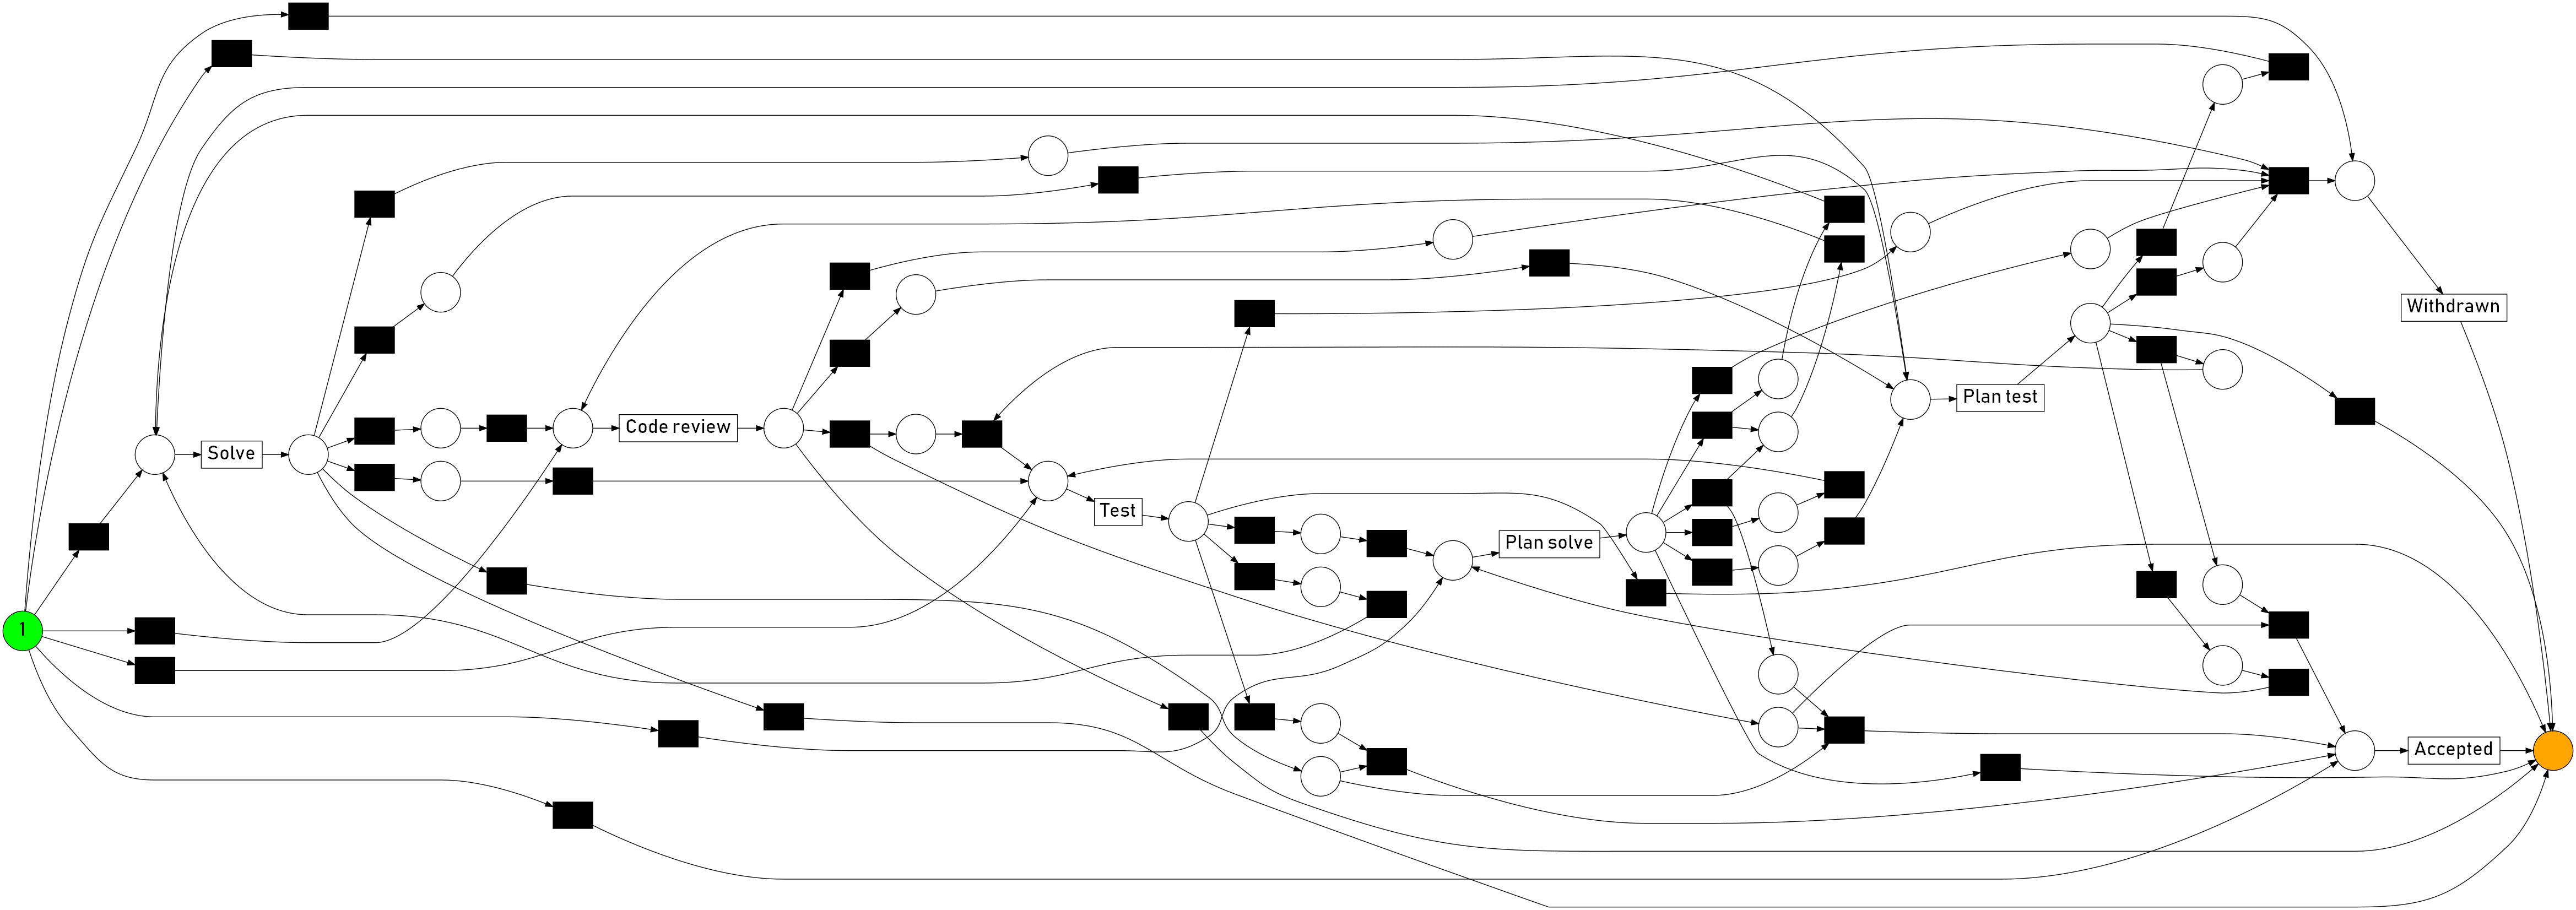
The above is the result of running the Heuristic Miner with standard parameters. Clearly some hyper parameter tuning is needed.
For the above model, we get a simplicity score of 58 out of 100 points and 53% tasks fit it. Let’s improve on that.
To start the tuning, we look at 4 parameters: dependency threshold, AND threshold, noise threshold and loop threshold. We run the Heuristic Miner a bunch of times using random values for these parameters and measure their impact on the KPIs (see below).
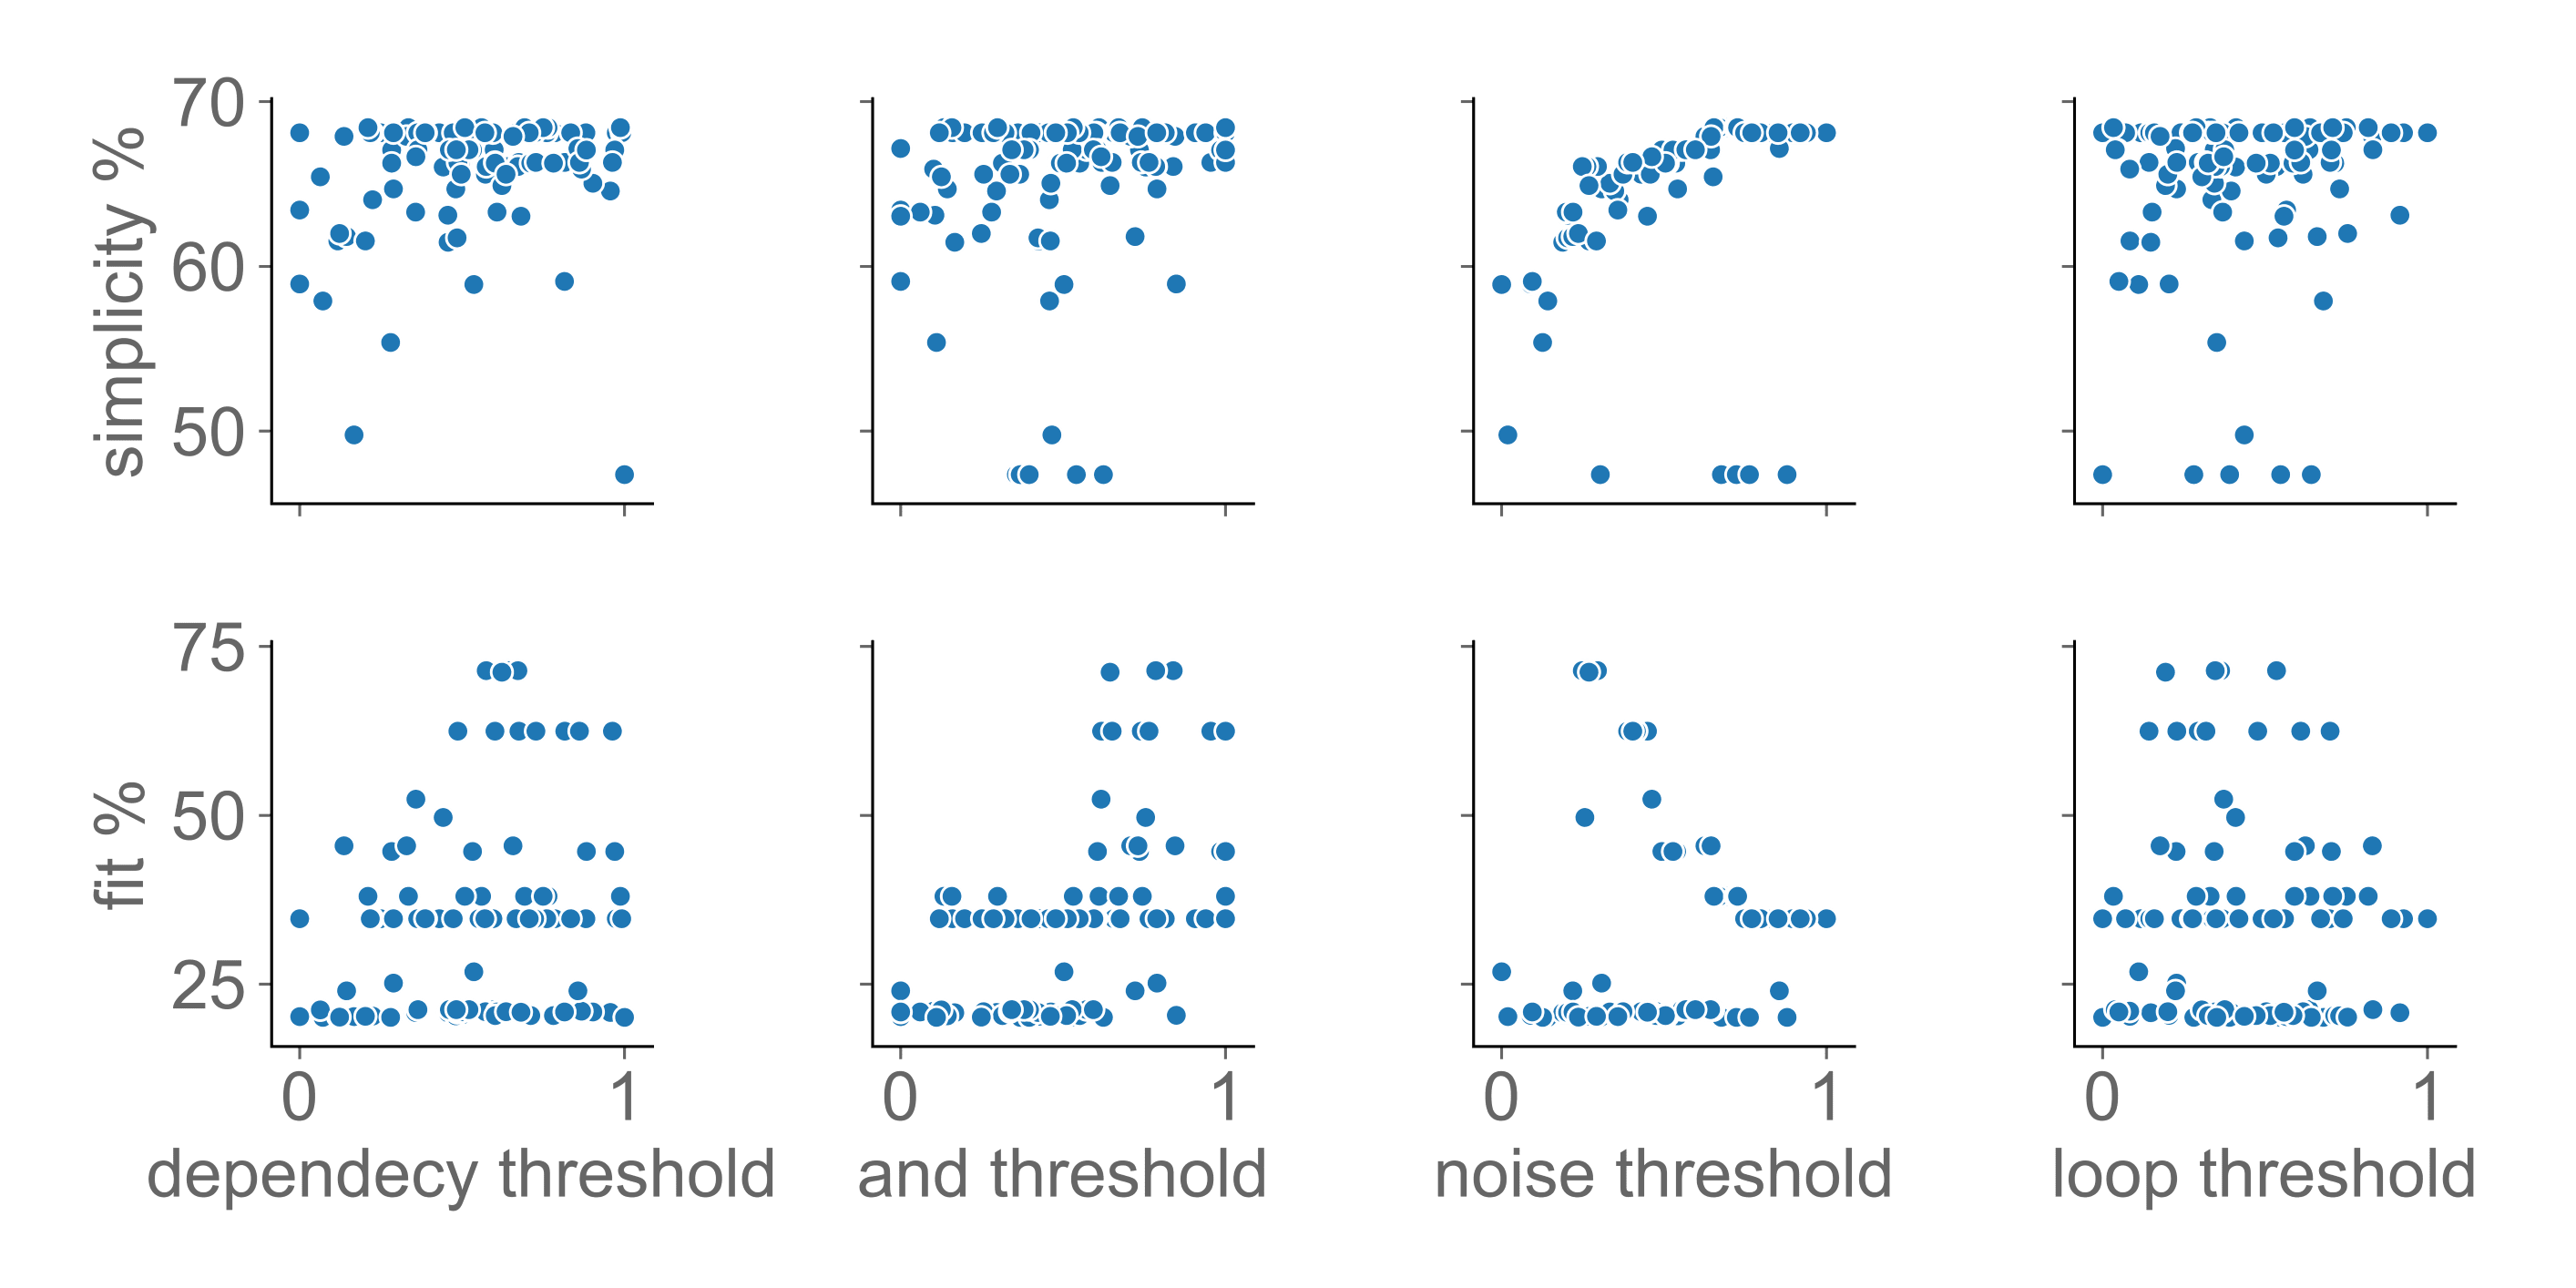
- Dependency threshold: Highest fit in upper third -> set to 75
- AND threshold: Highest fit in upper third -> set to 75
- Noise threshold: Trade-off between fit and simplicity -> set to 4
- Loop threshold: No clear tendency -> set to 5
With the new parameters the simplicity score went up from 58 to 66 points and the number of fits from 53% to 62%. The result looks as follows:

A bit of history
At Ab Ovo, the workflow is subject to continuous evolution. Usually at the start of each individual project the team agrees on which process to follow. As a result, best practices regarding process emerge over time in the organization. For instance, this is the process used in 2011 (computed again using Heuristic Miner):

With this in mind, we can reformulate the question posted in the beginning:
How have our processes evolved to support Efficiency, Quality and Transparency in our projects?
We can start answering that question by simply discovering the model every year from 2011 to 2019 and tracking the model KPIs, along with the frequency of statuses used.
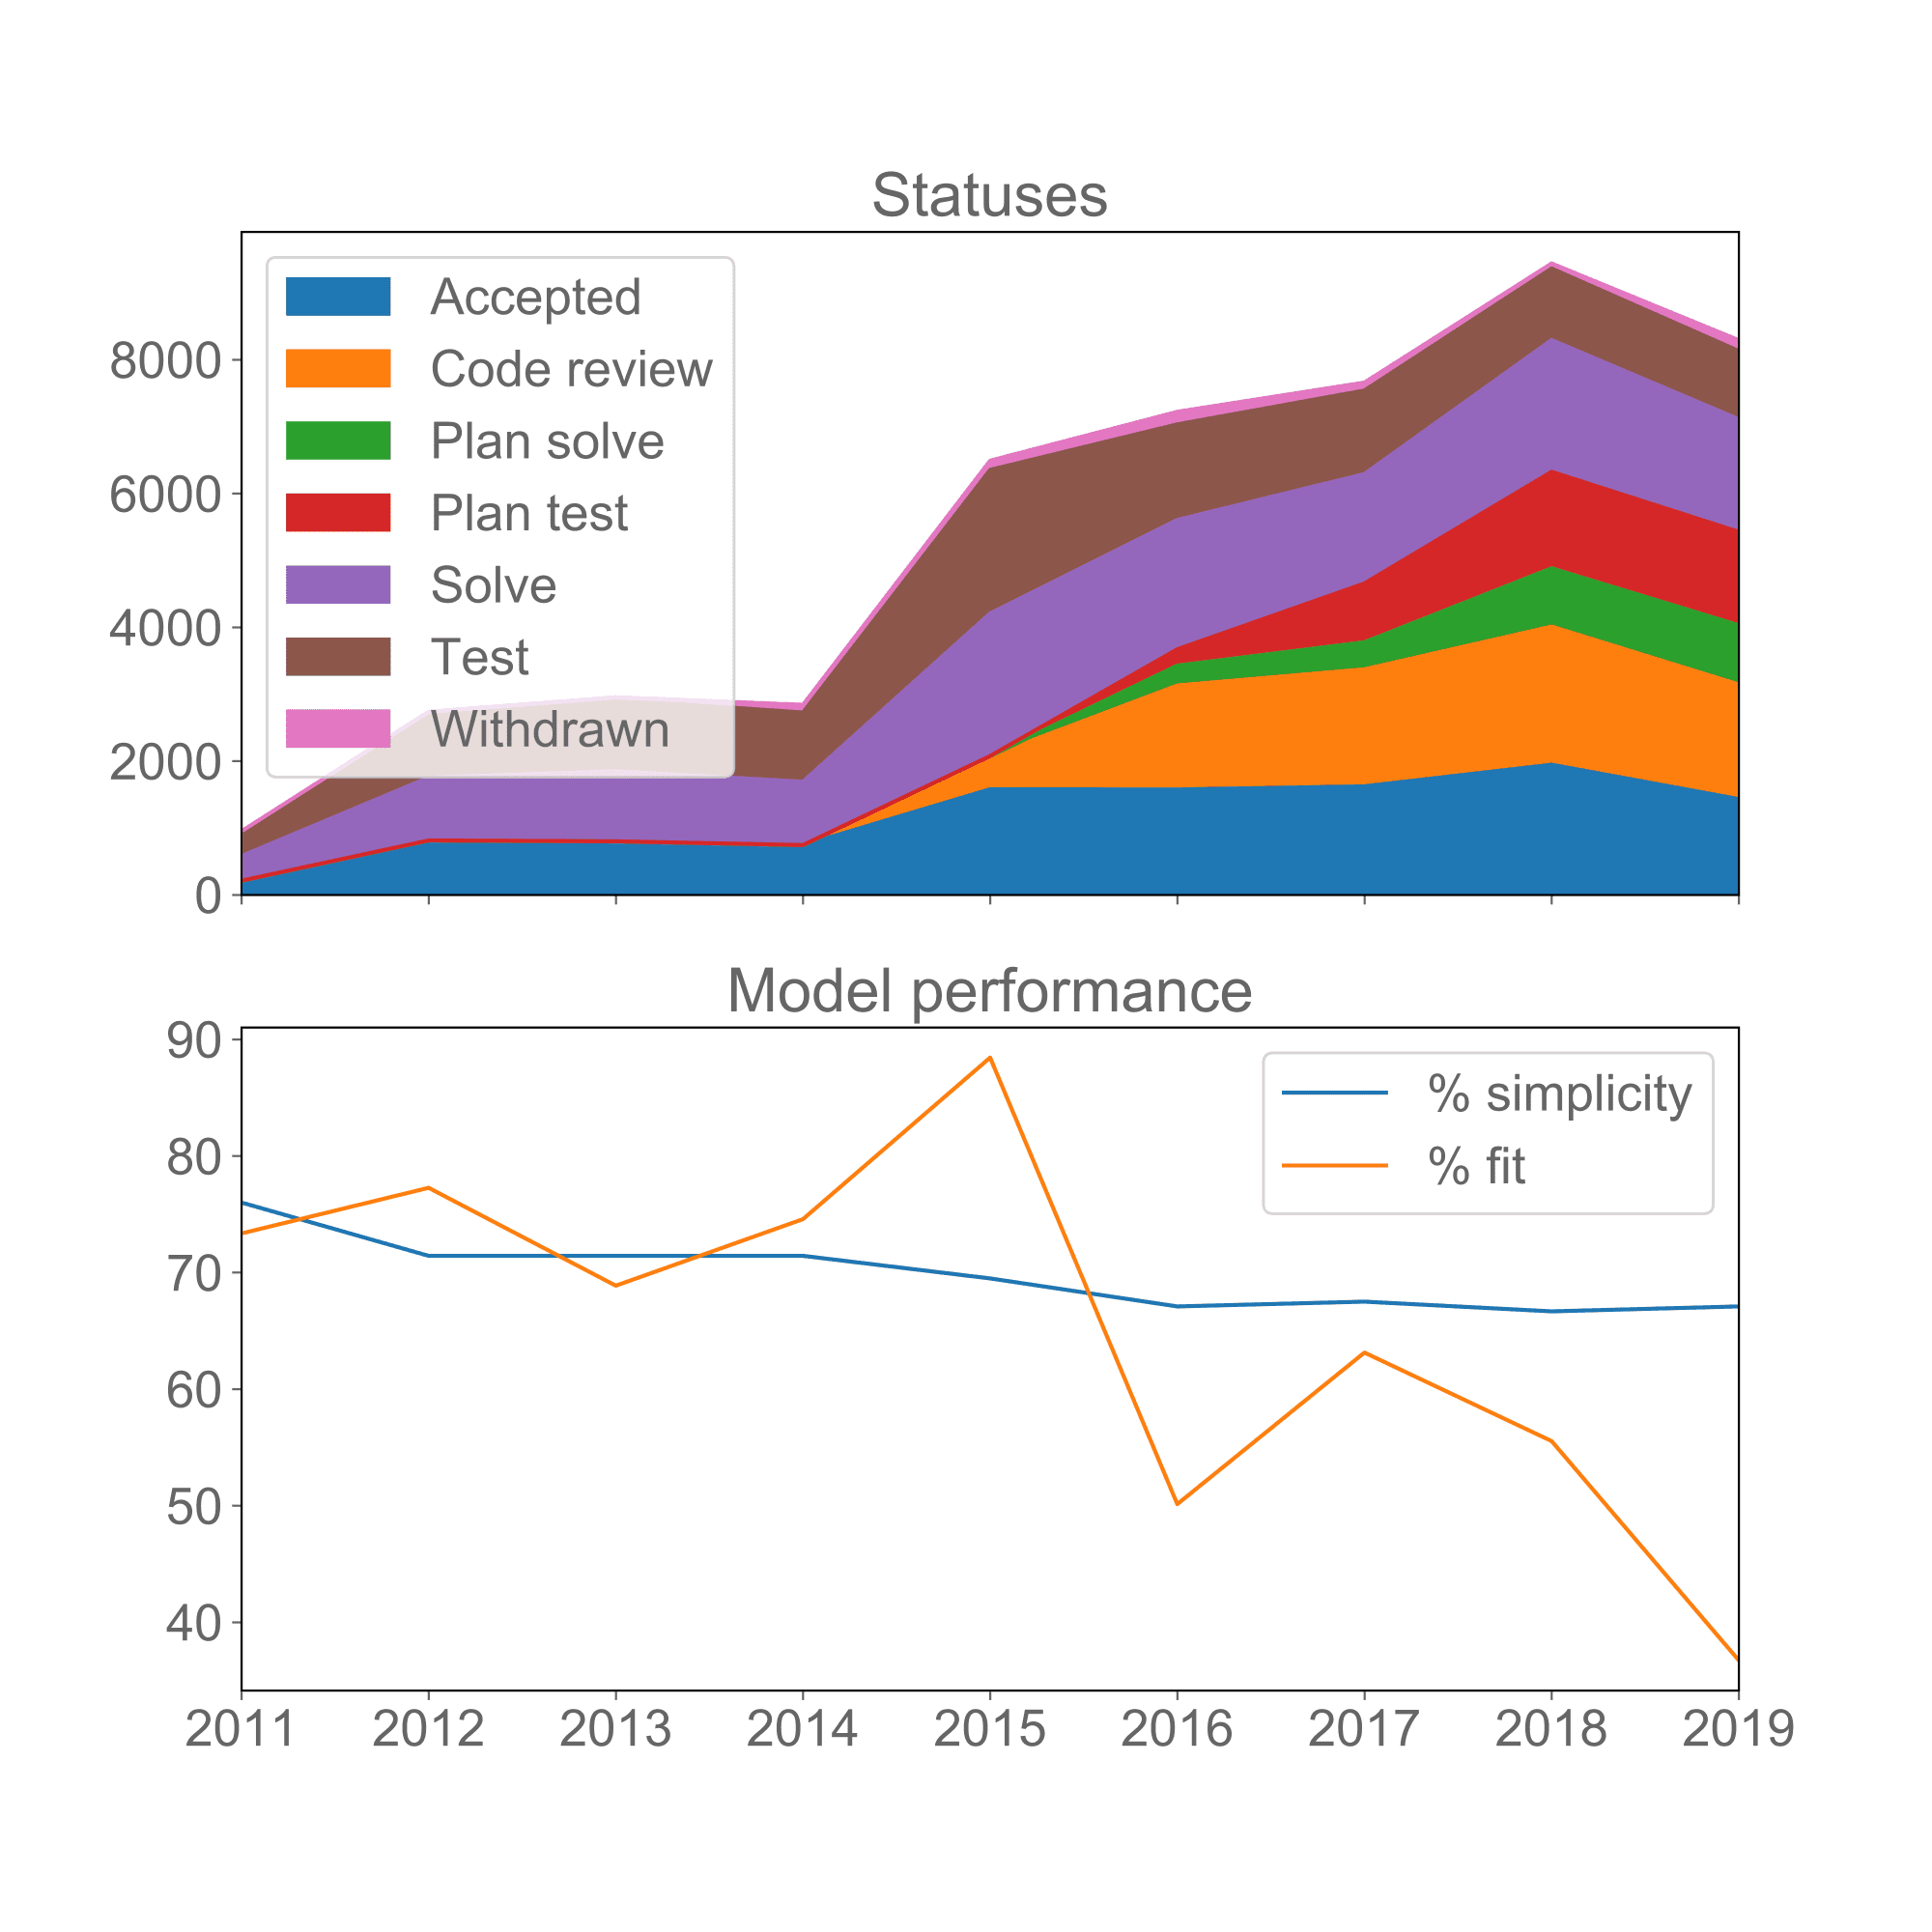
Focusing first on the upper graph the first thing we notice is activity increasing over time as internal adoption of the system grew.
In 2015, a new status “Code review” was introduced, which gained popularity in 2016, promoting the goal of Quality.
One year later, “Plan solve” and “Plan test” were added: As teams and projects have become bigger and more complex, knowing which tasks were already being worked actively vs which were ready to be picked up has helped to avoid miscommunication and double work. So, they served to increase Efficiency.
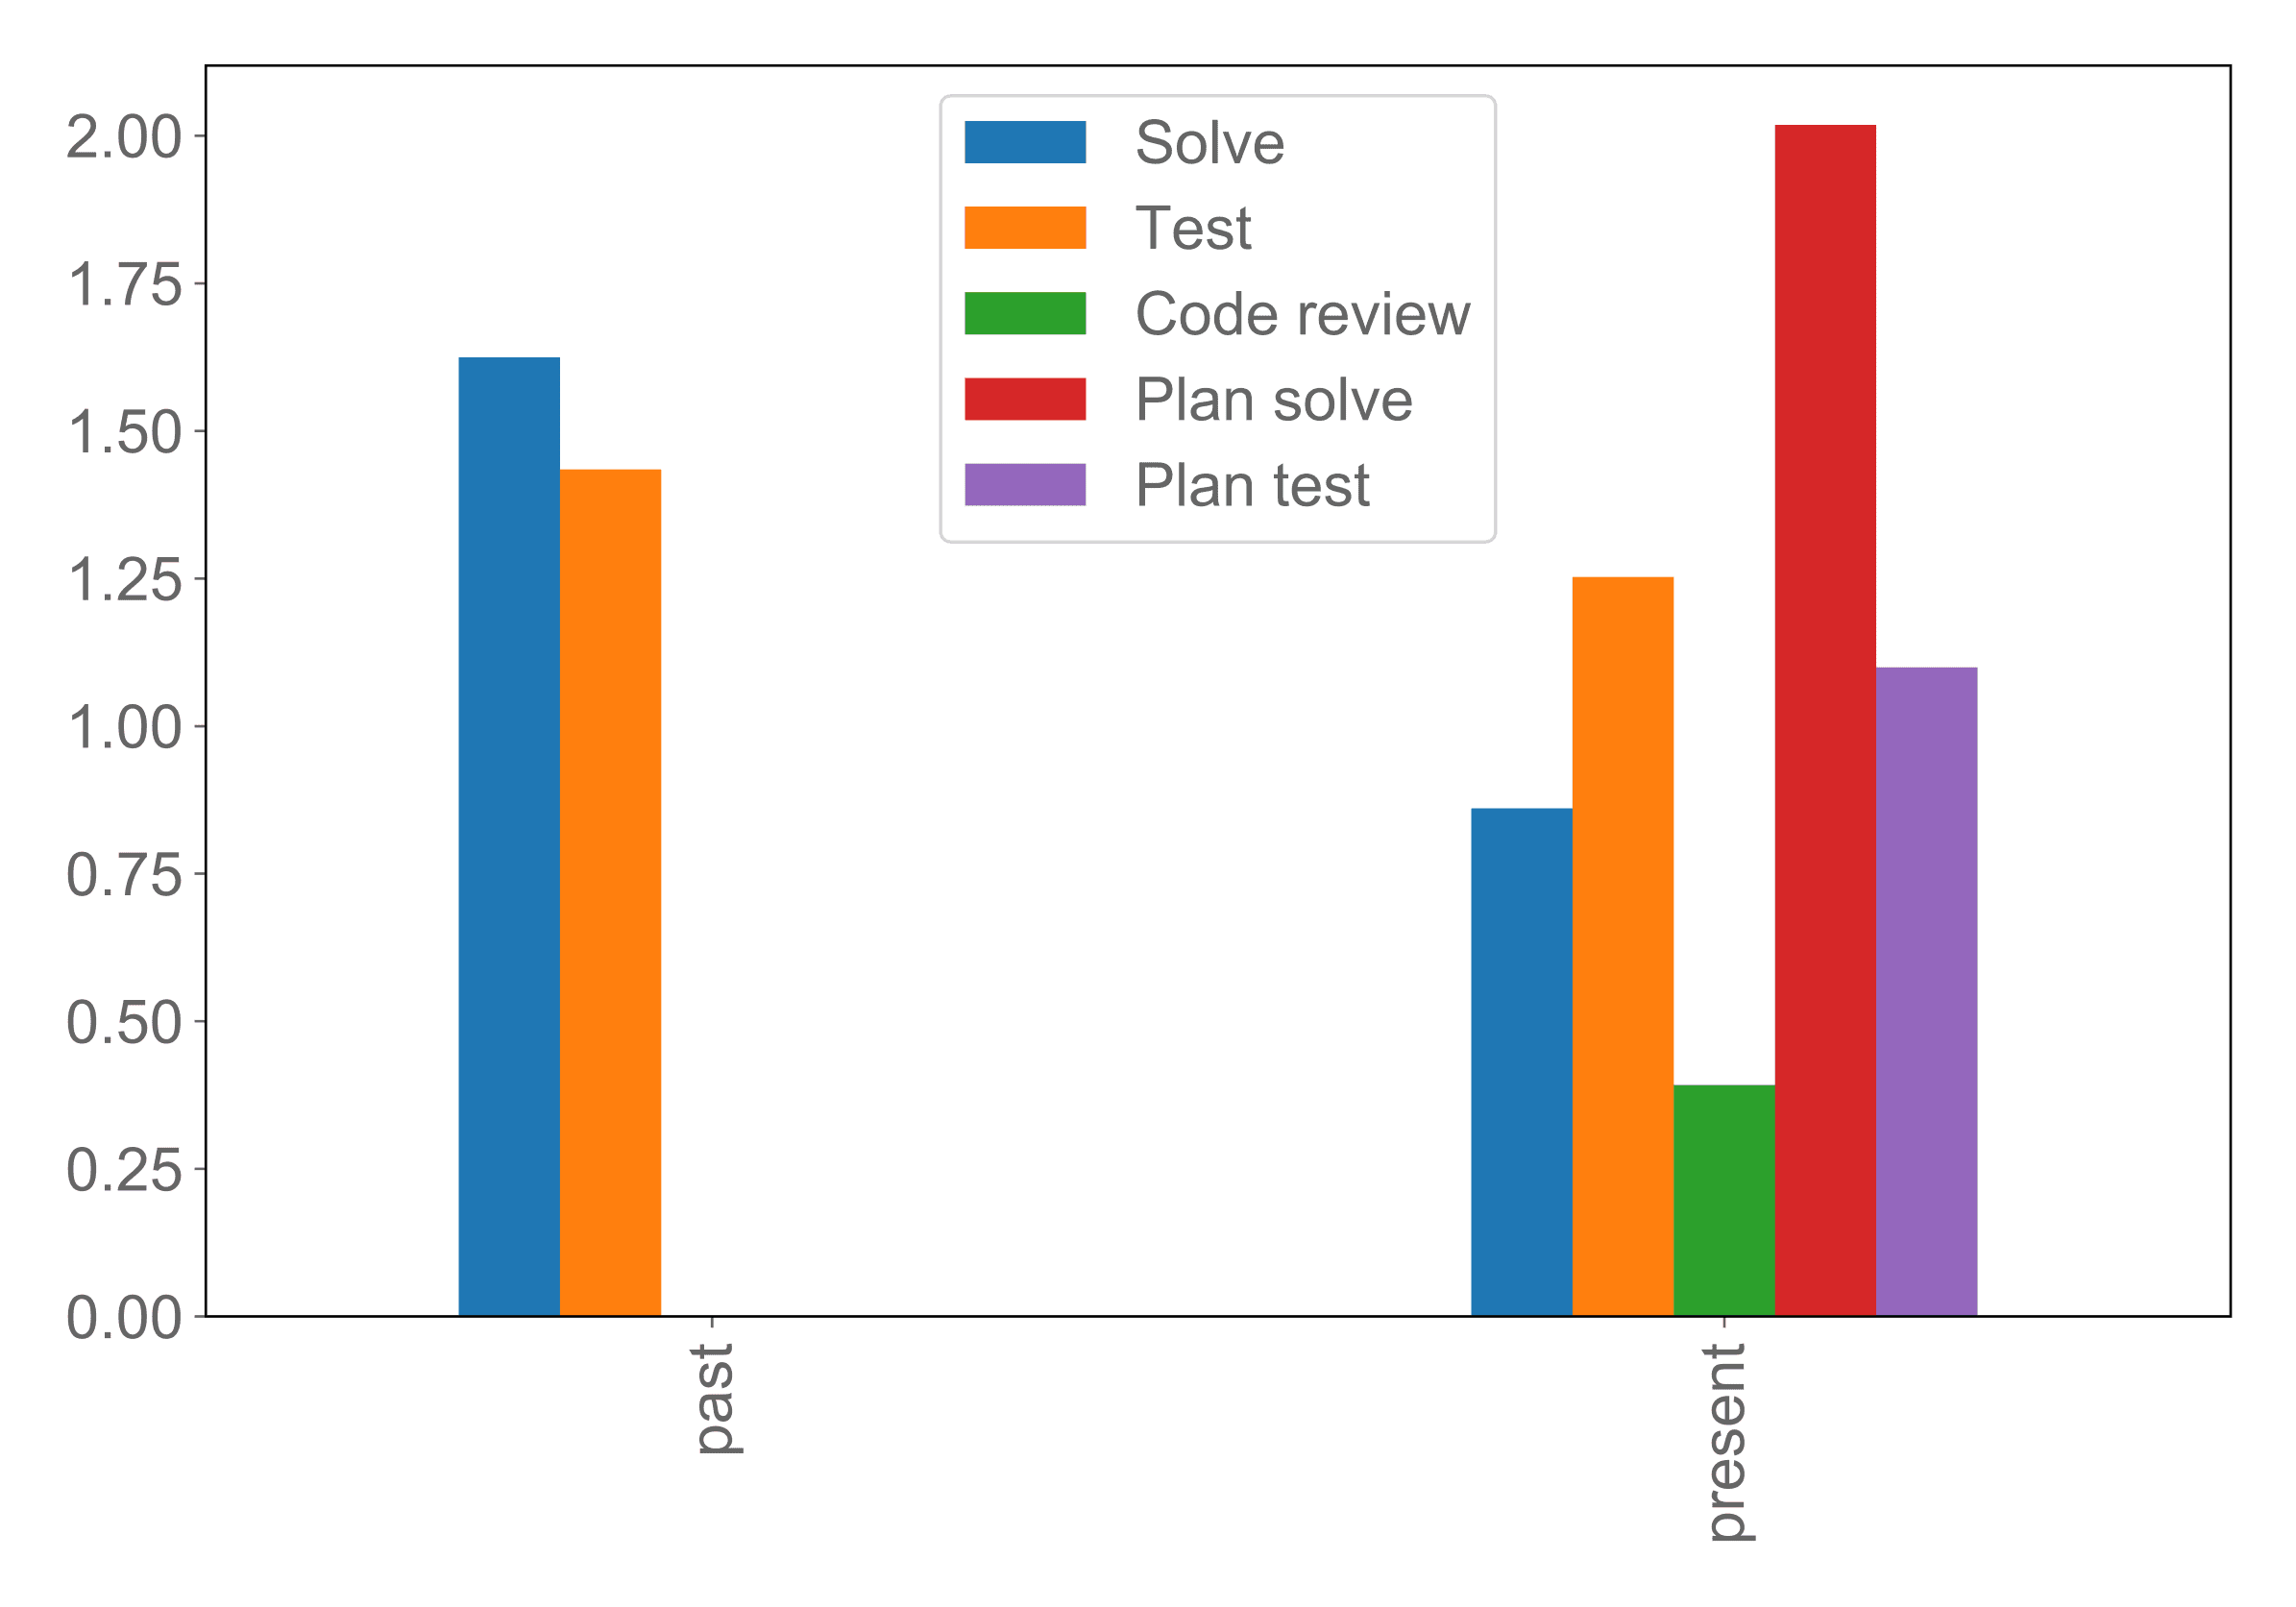
See below a comparison how many days the typical tasks stay assigned to a given status in the old vs in the new process. As we can see, much of the time spent in work-in-progress statuses is shifted towards waiting statuses, so if a lot of tasks are in Solve or Test one can now a lot of progress is actually happening, which serves Transparency.
All these improvements have been great. But a glance at the lower half of the timeline shows their cost: From a peak in 2015 we see a steep decline in model fit, coinciding with the adoption of the new statuses. At the same time, model simplicity decreases slowly but steadily over time. If it becomes harder to compute a model with is both simple and fitting the observed behavior, the behavior must be getting more complex and varied. We see in the logs that as more steps are added, some of them tend to get skipped.
Summarized outcomes
So, in conclusion, the outcomes of our process mining exercise have shown that having more statuses can have an impact on the simplicity indicator resulting in a more complex issue handling process. So, our lesson learned here is that rather than adding new statuses, we should focus on consolidating the model we use now. This will be used in our periodic issue tracking system evaluations, keeping us sharp to build our analytics effective and efficient.
Do you want to learn how process mining can help you improve your processes? Contact us to learn more about how to start your process mining journey! For more inspiration please read our process mining use case for the healthcare industry [in Dutch].
